Downtown SLC Economic
Benchmark Report
MAY 2025
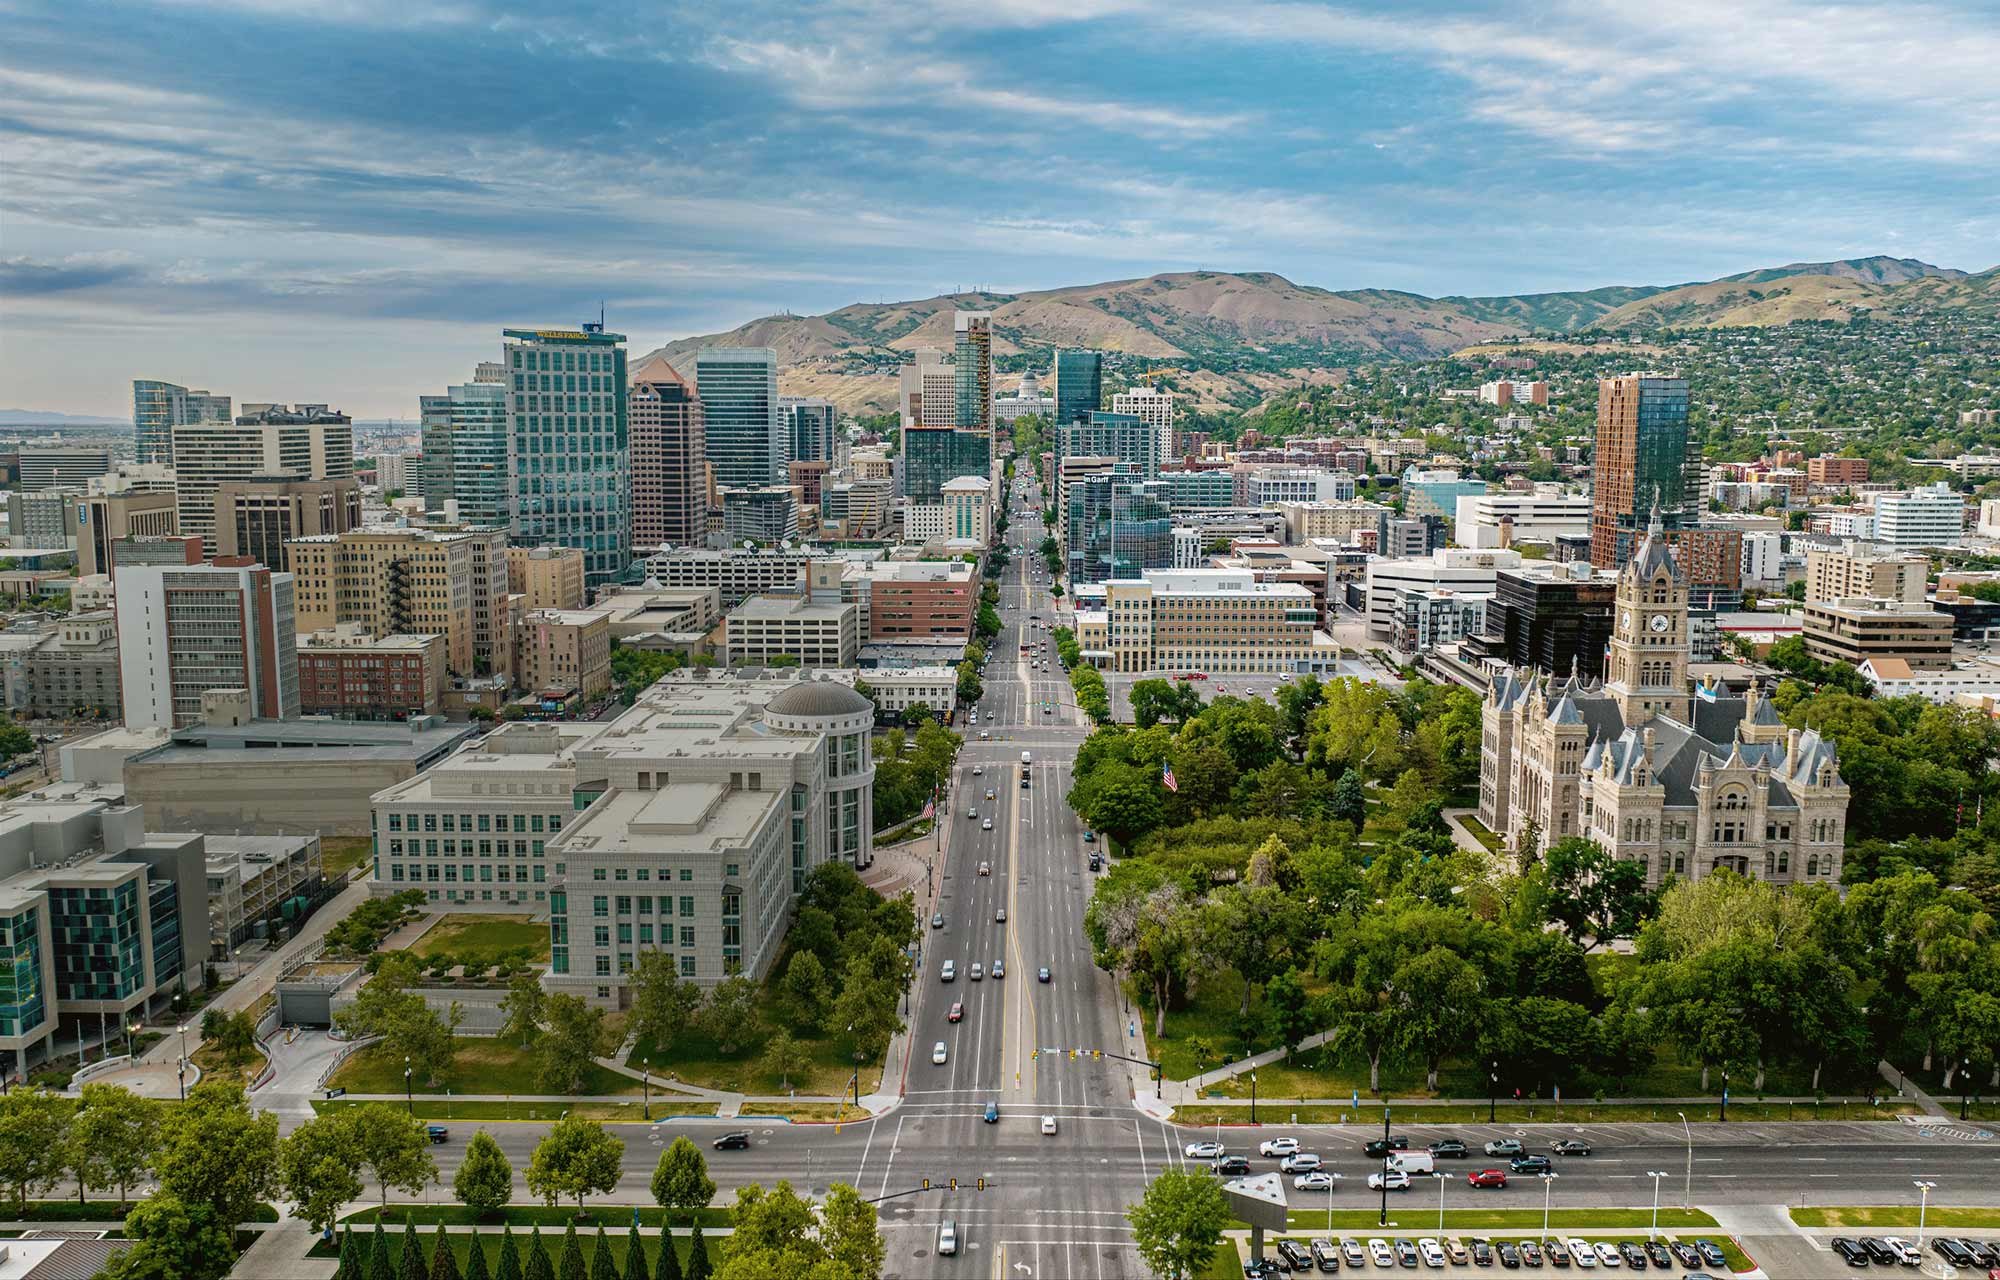
Thumbs Up Salt Lake City!
Our 2024 data demonstrates growth in customers, visitors, workers, residents & event ticket sales.
Downtown Customer Days Increased Again in 2024
Visitors, workers and residents fuel the downtown SLC economy. Downtown customer days increased 3.6% YoY in 2024. 63% of those days were created by visitors followed by downtown workers (30%) and downtown residents (7.5%).
What is a downtown customer day?
When someone spends more than 90 minutes downtown, the Alliance counts them as a customer. We use mobile phone data to measure three types of customers: downtown residents, downtown workers and downtown visitors (people that do not live or work downtown).
20.9M Total
Customer Days
↗3.6% YoY

Top Customer Days
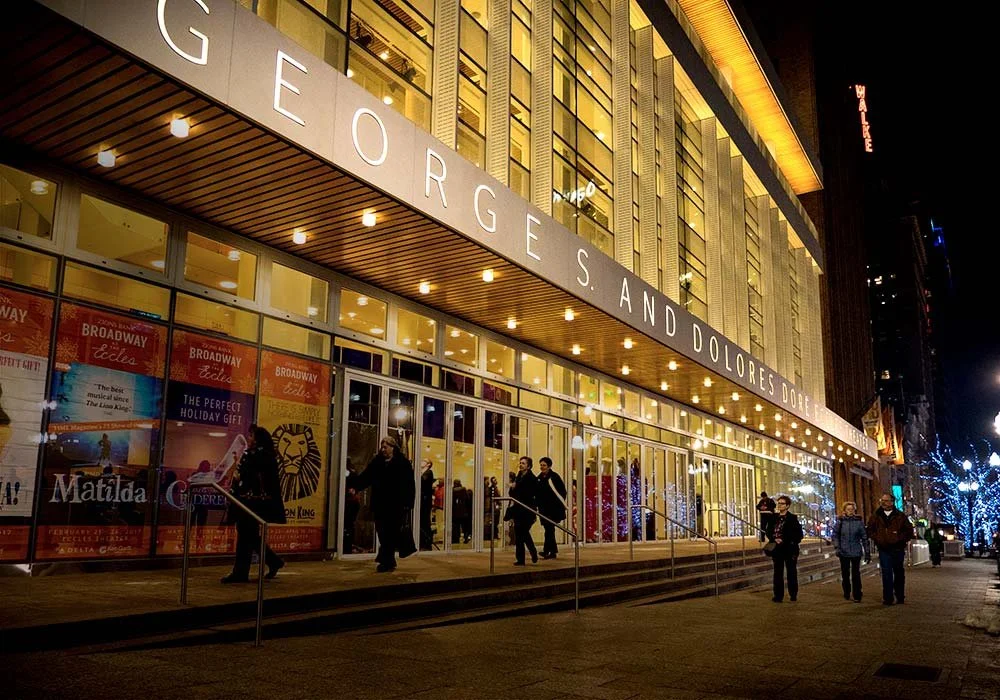
In 2024, the 36 days that had the highest downtown visitation were highly correlated with days which had major conventions, events at the Delta Center, and performances at Abravanel, Capitol, Rose Wagner and Eccles theaters.
had conventions at the Salt Palace and major hotels.
83%
had events at the Delta Center.
71%
had 4 or more events at Abravanel, Eccles, Capital & Rose Wagner theaters.
63%
Total Tickets Sold at Performance Venues
$4.05M tickets sold: AN 18.4% increase year-over-year


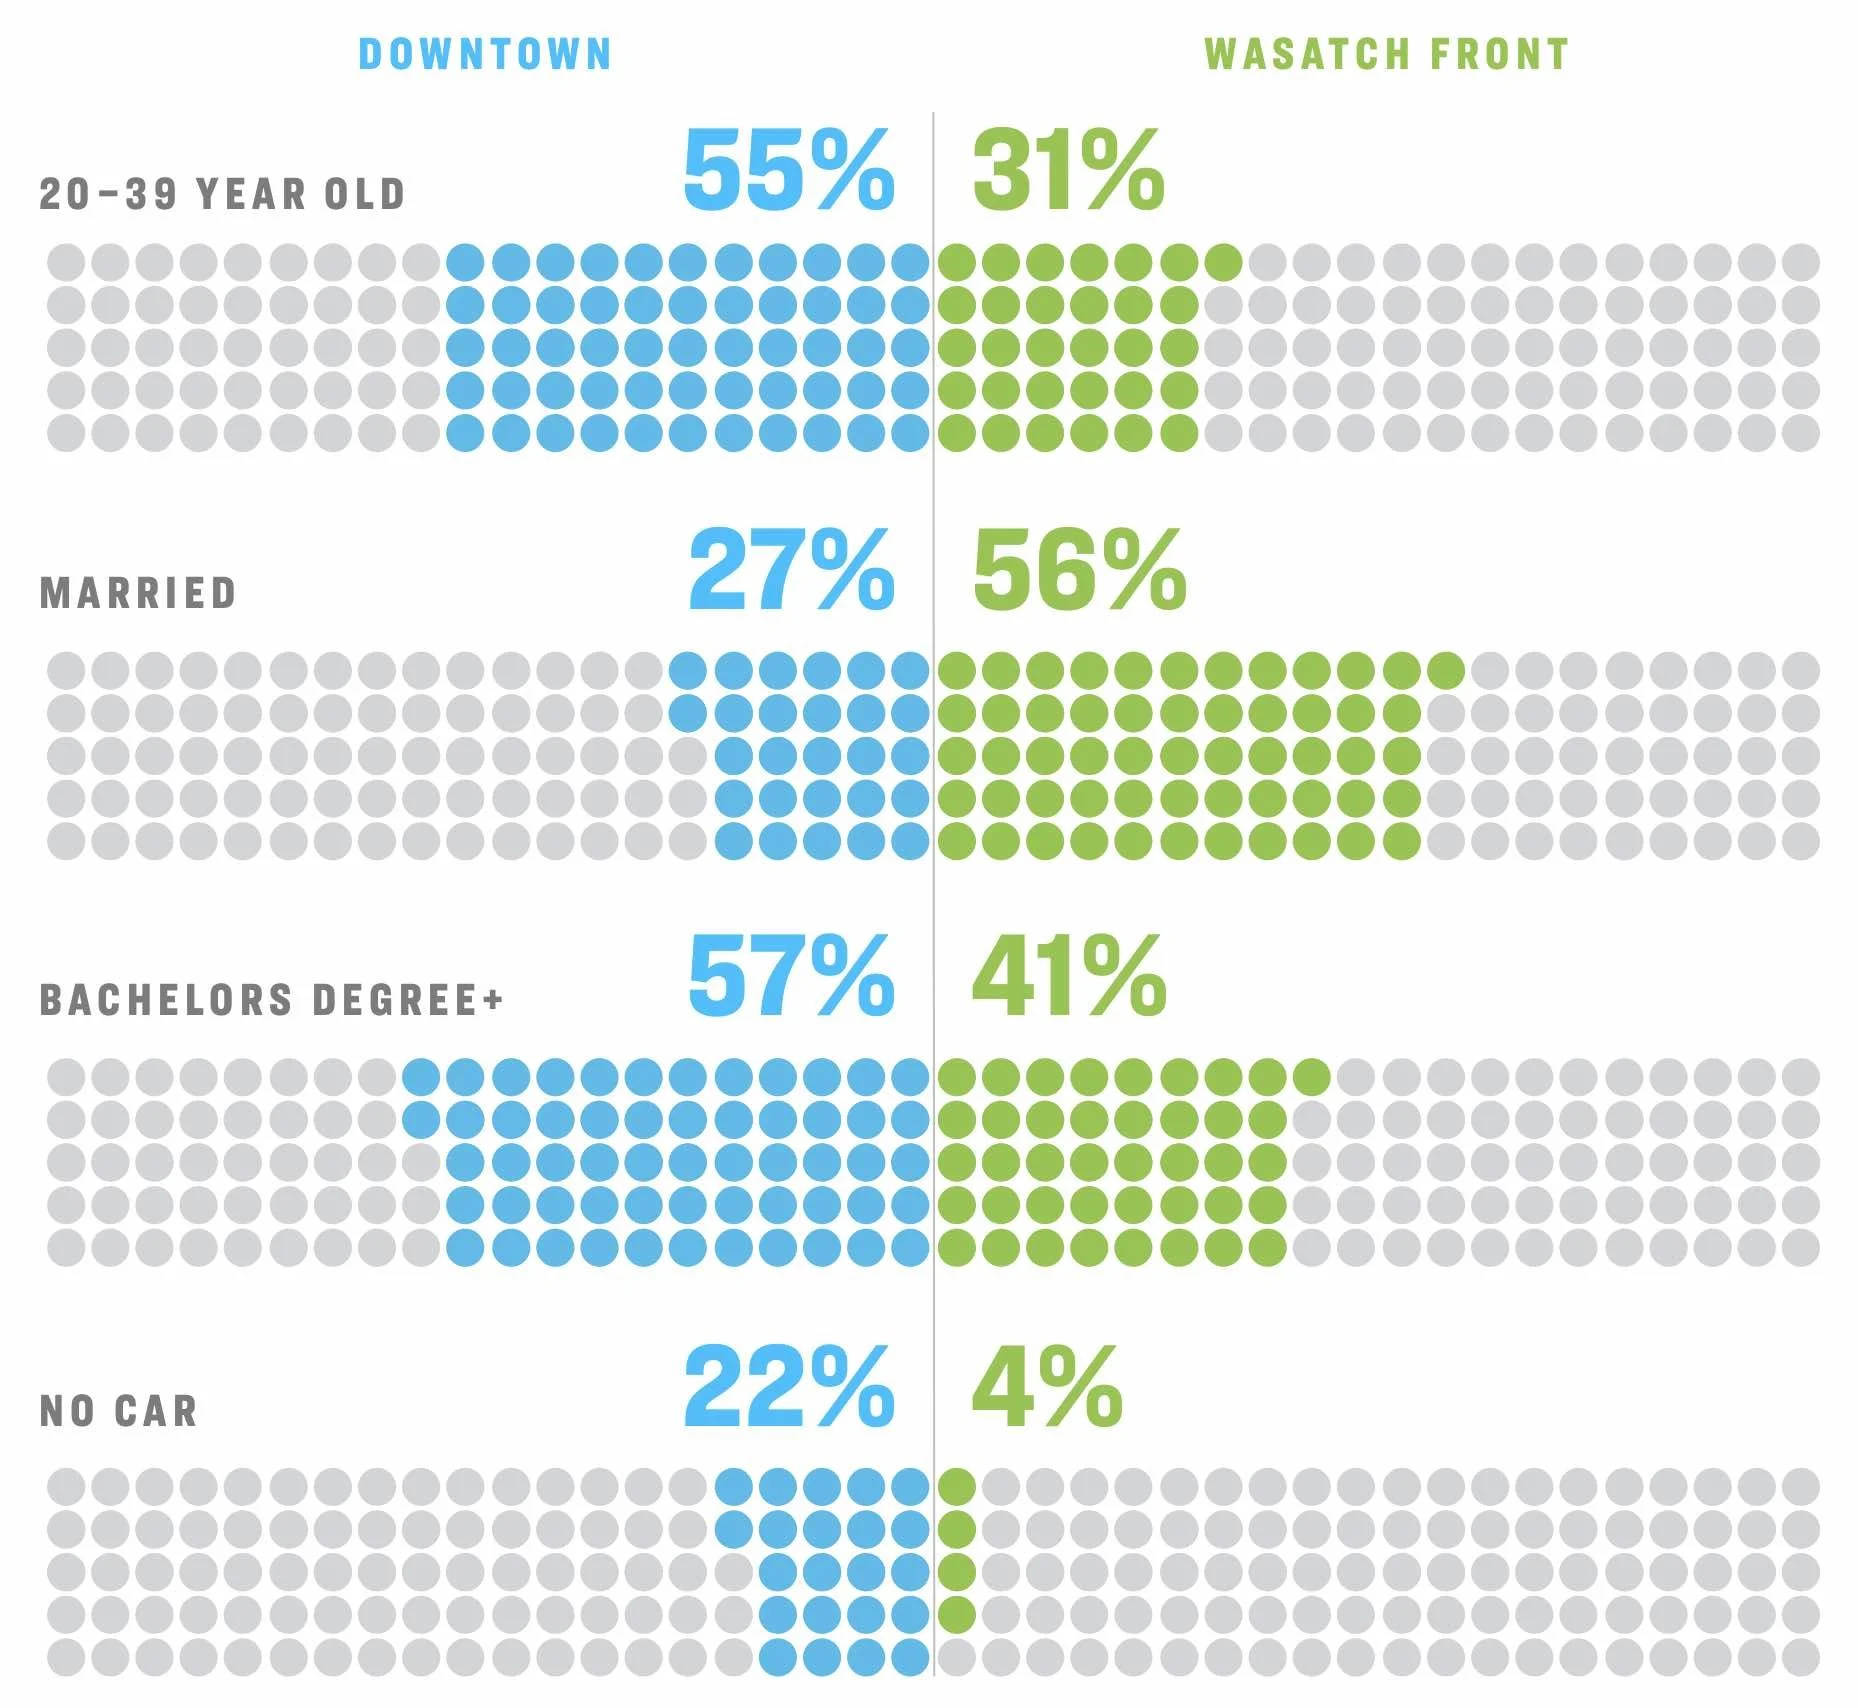
Who is Living Downtown?
When compared to Wasatch Front residents, Downtown residents are younger, less likely to be married, more likely to have a college degree, and less likely to have a car. The number of residents downtown grew 27.5% last year and is projected to grow another 28% by 2030.
Downtown worker days increased 10.5% YoY in 2024 as employees chose – and employers required – more team interaction in the office. Workers’ time in the office is projected to increase 10% in 2025: a positive trend for restaurants, merchants and office leasing.
Customer Opportunities Worth Watching
We are bullish on retail concepts targeting downtown’s young professional residents–think personal health, fitness, pet care, and other services.
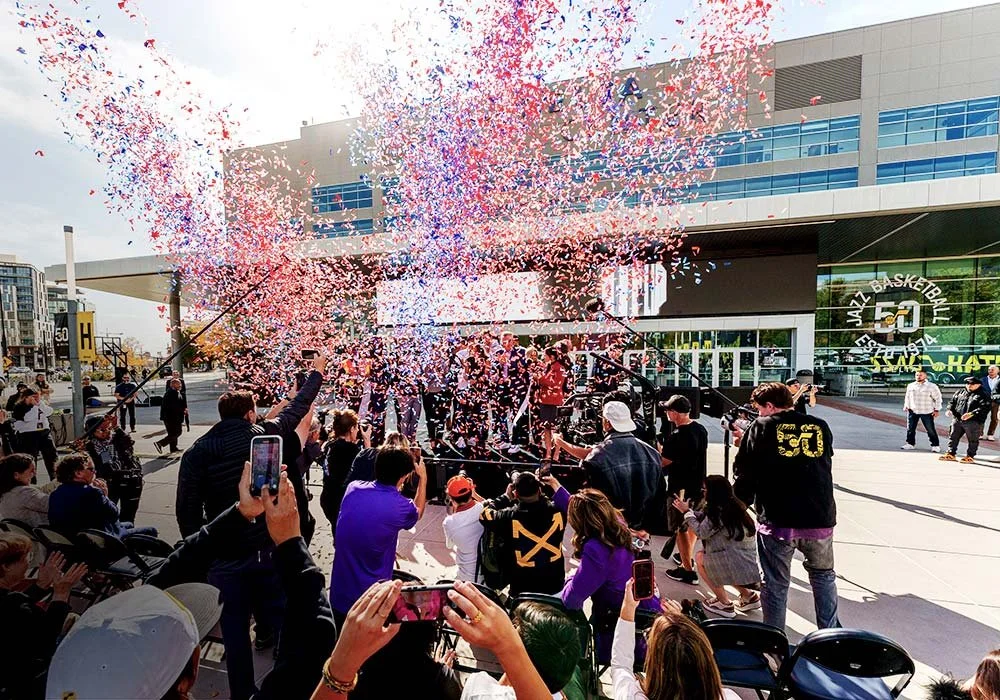
We see opportunities for food & beverage operators that capitalize on the growing audience for downtown sports, entertainment, and arts. Total ticket sales for downtown events were up 18.3% over 2023. We expect further attendance growth with the new NHL Utah franchise and the $4 billion investment in the entertainment district downtown.


Retail

Retail Rents are up; vacancies vary between traditional and mixed-use inventory
Downtown residential, worker and visitor populations are growing — stoking demand for retail and services. Vacancies for traditional downtown retail space in anchored shopping centers are at the lowest point since 2019. However, vacancies are significantly higher, on average, in downtown residential mixed-use projects. Average starting rents for retail spaces city-wide were $26.36 (yearly PSF NNN) in 2024, up 19.6% over 2019.
Rates below are SF-weighted.

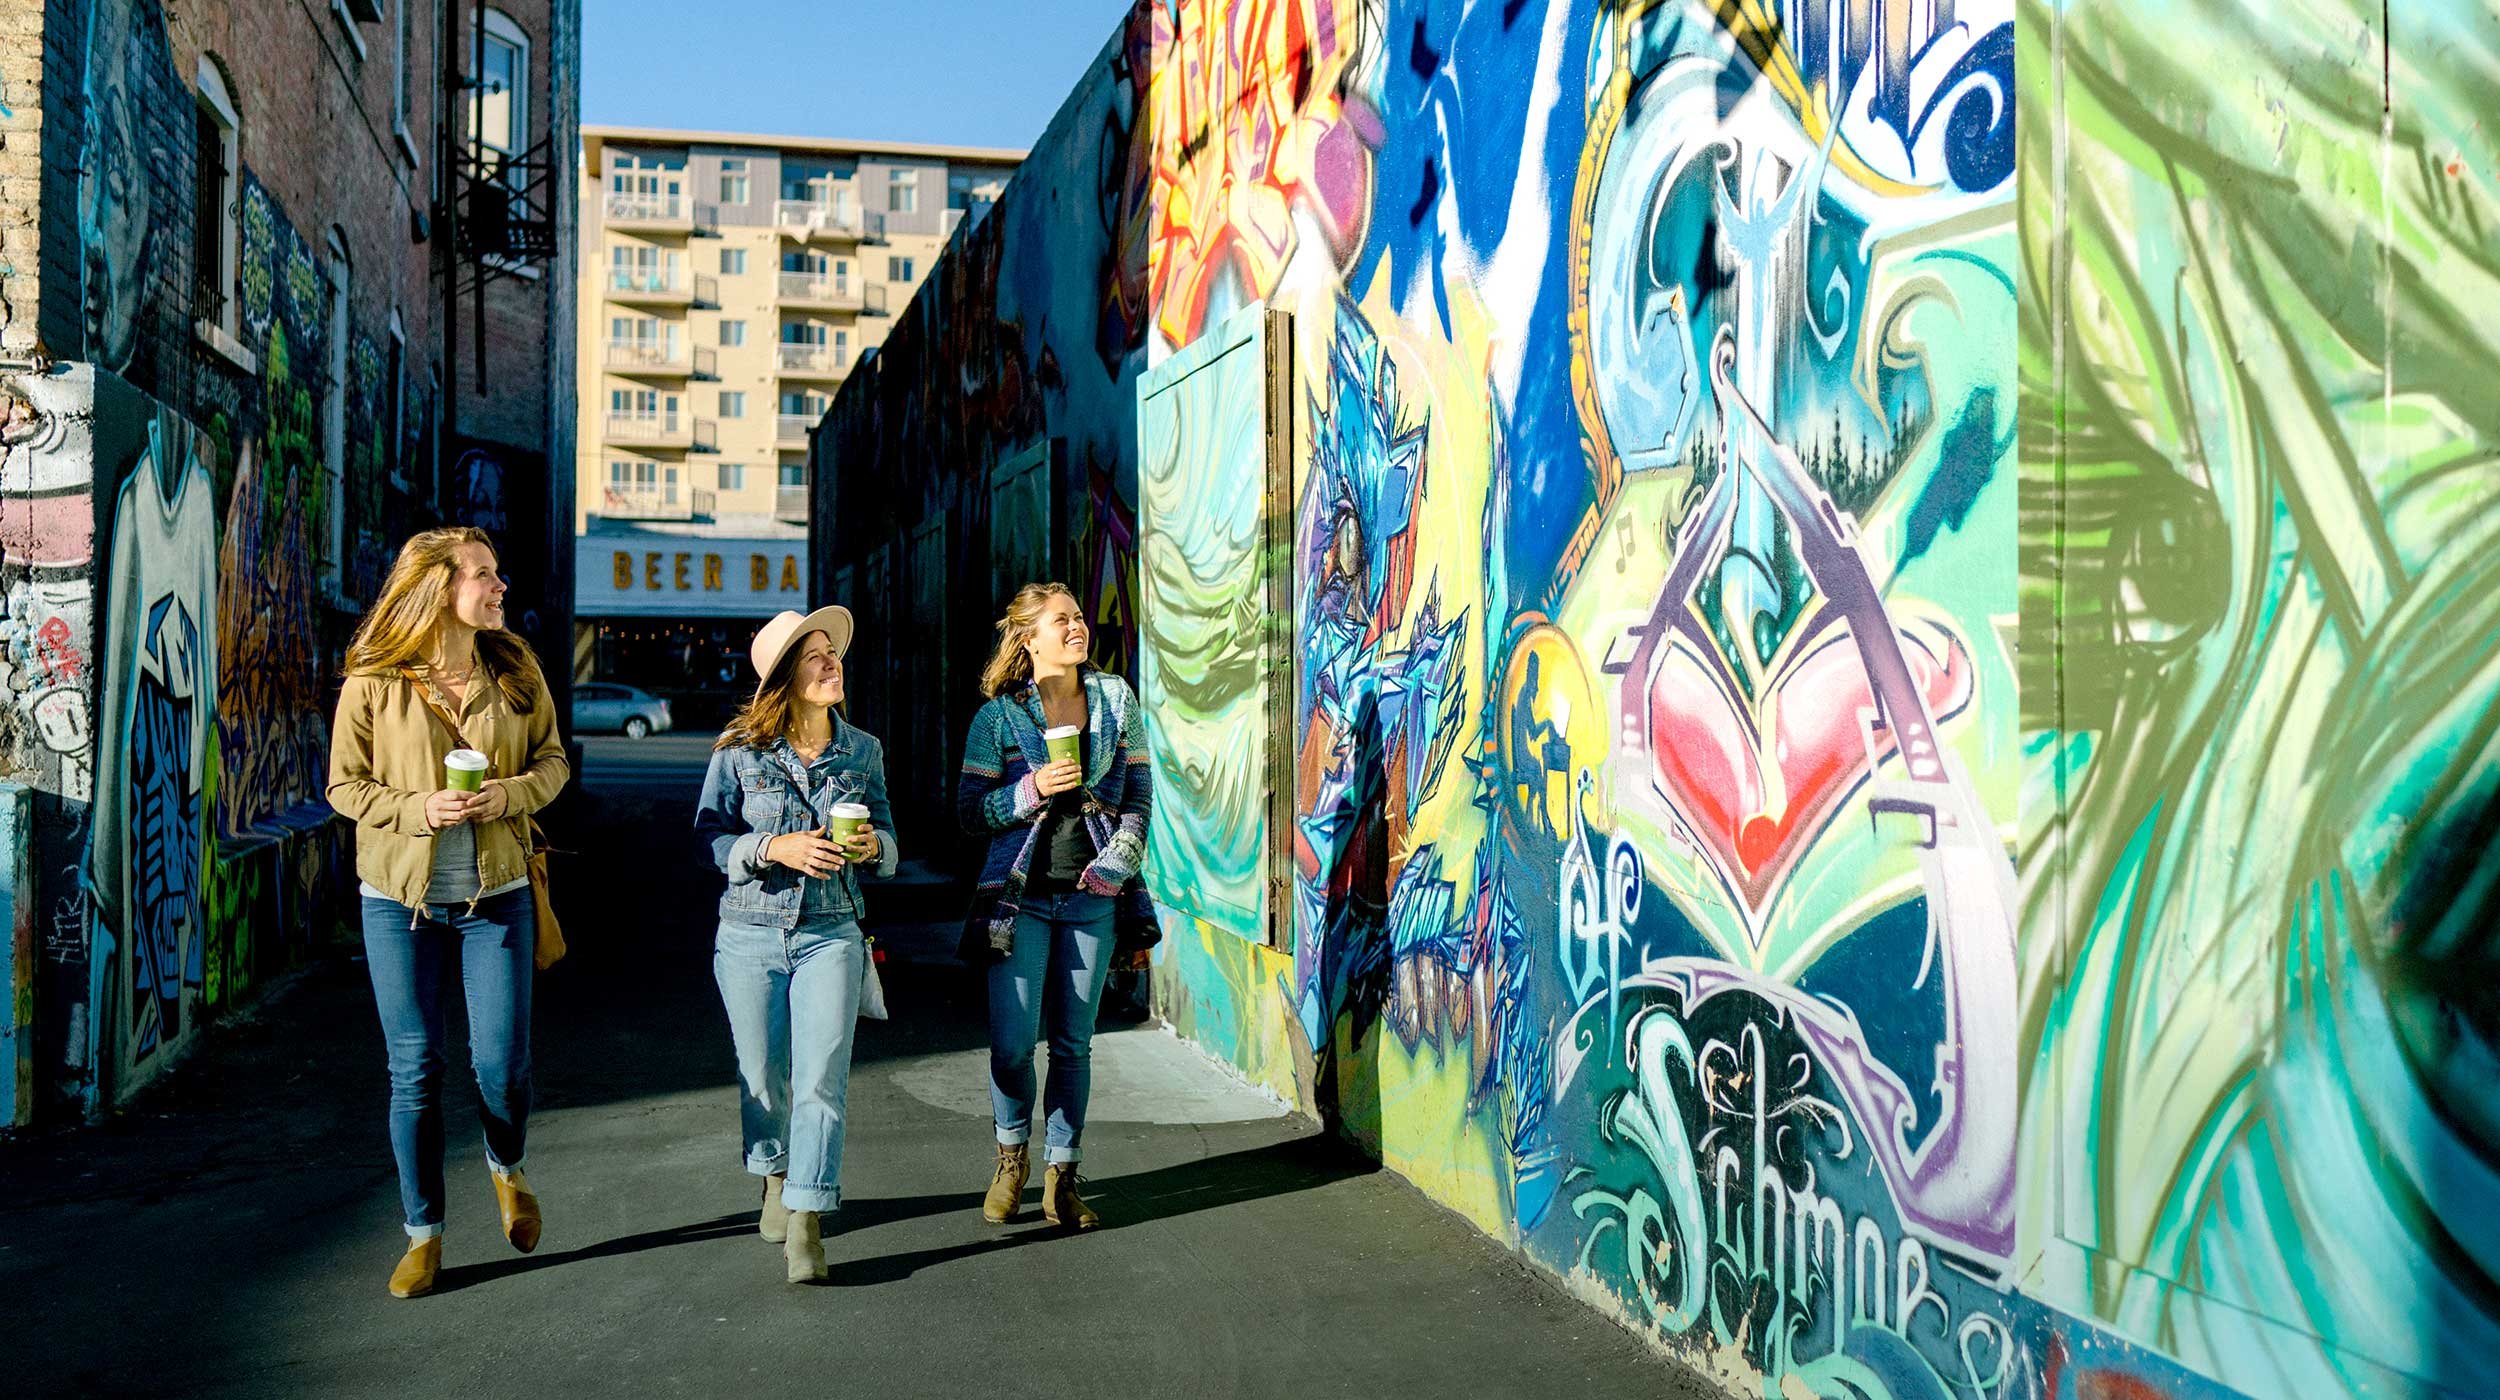
Downtown’s shopping and nightlife offerings includes 221 bars and restaurants and 204 merchants including local favorites and international luxury brands.

Office Market


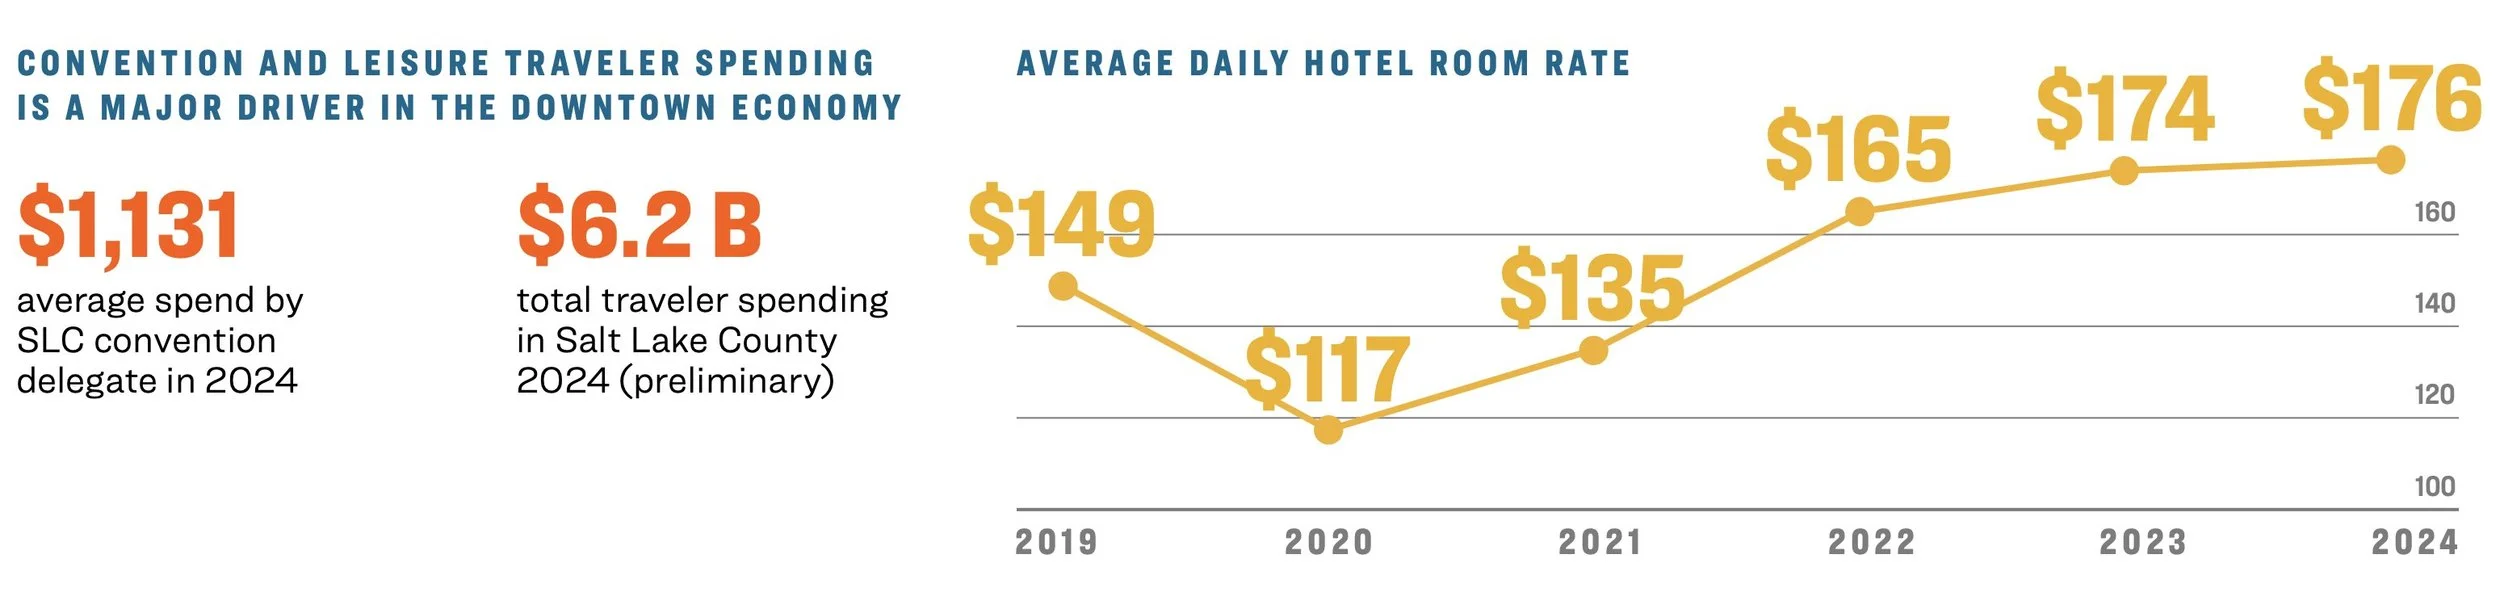
Visitor Economy

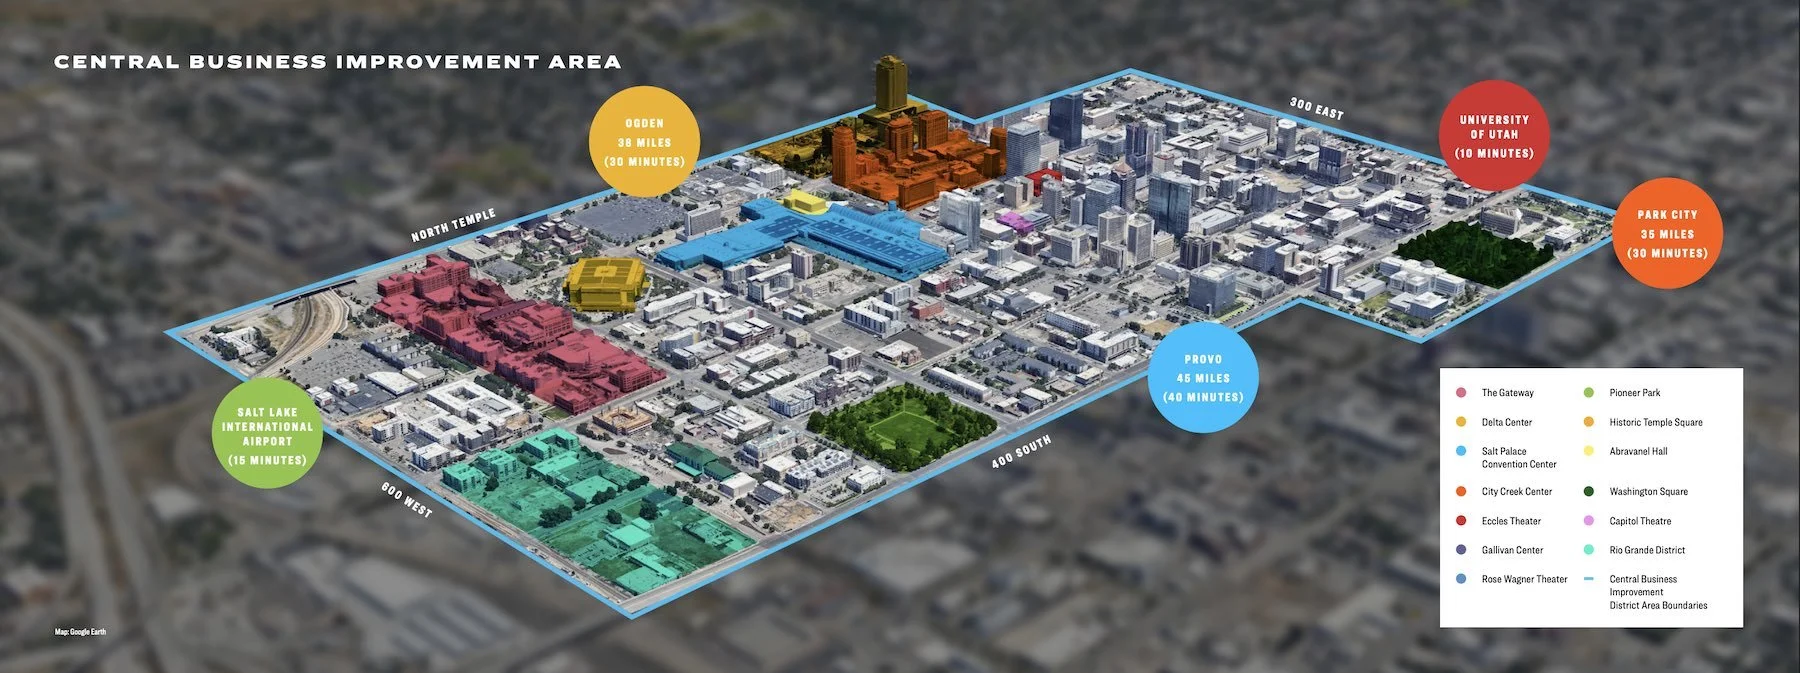
Transportation

SLC International Airport
» 338 daily departures serving 100 non-stop destinations.
» 14 airlines
» Delta Airline’s Mountain West Region hub
» 28.4 million annual passengers
» 100 non-stop destinations including 13 International flights including Asia and Europe.
» Named best airport in North America by Airhelp.

Utah Transit Authority Downtown Connections
TRAX light rail service from the airport every 15 minutes TRAX and Frontrunner rail service from University of Utah, Provo, Lehi, Draper, South Jordan, Farmington and Ogden
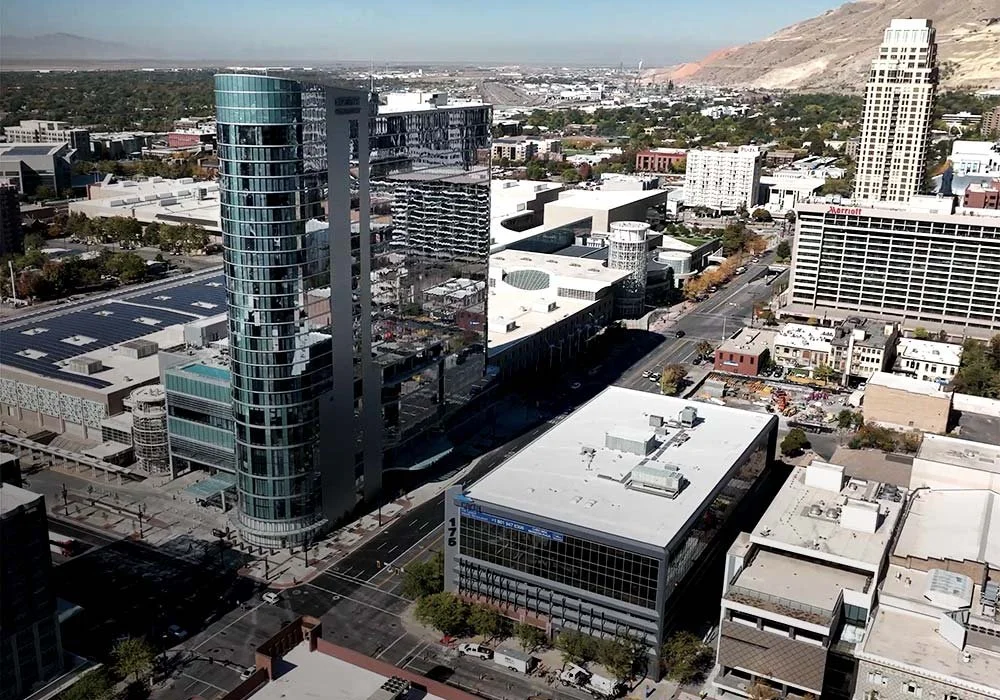
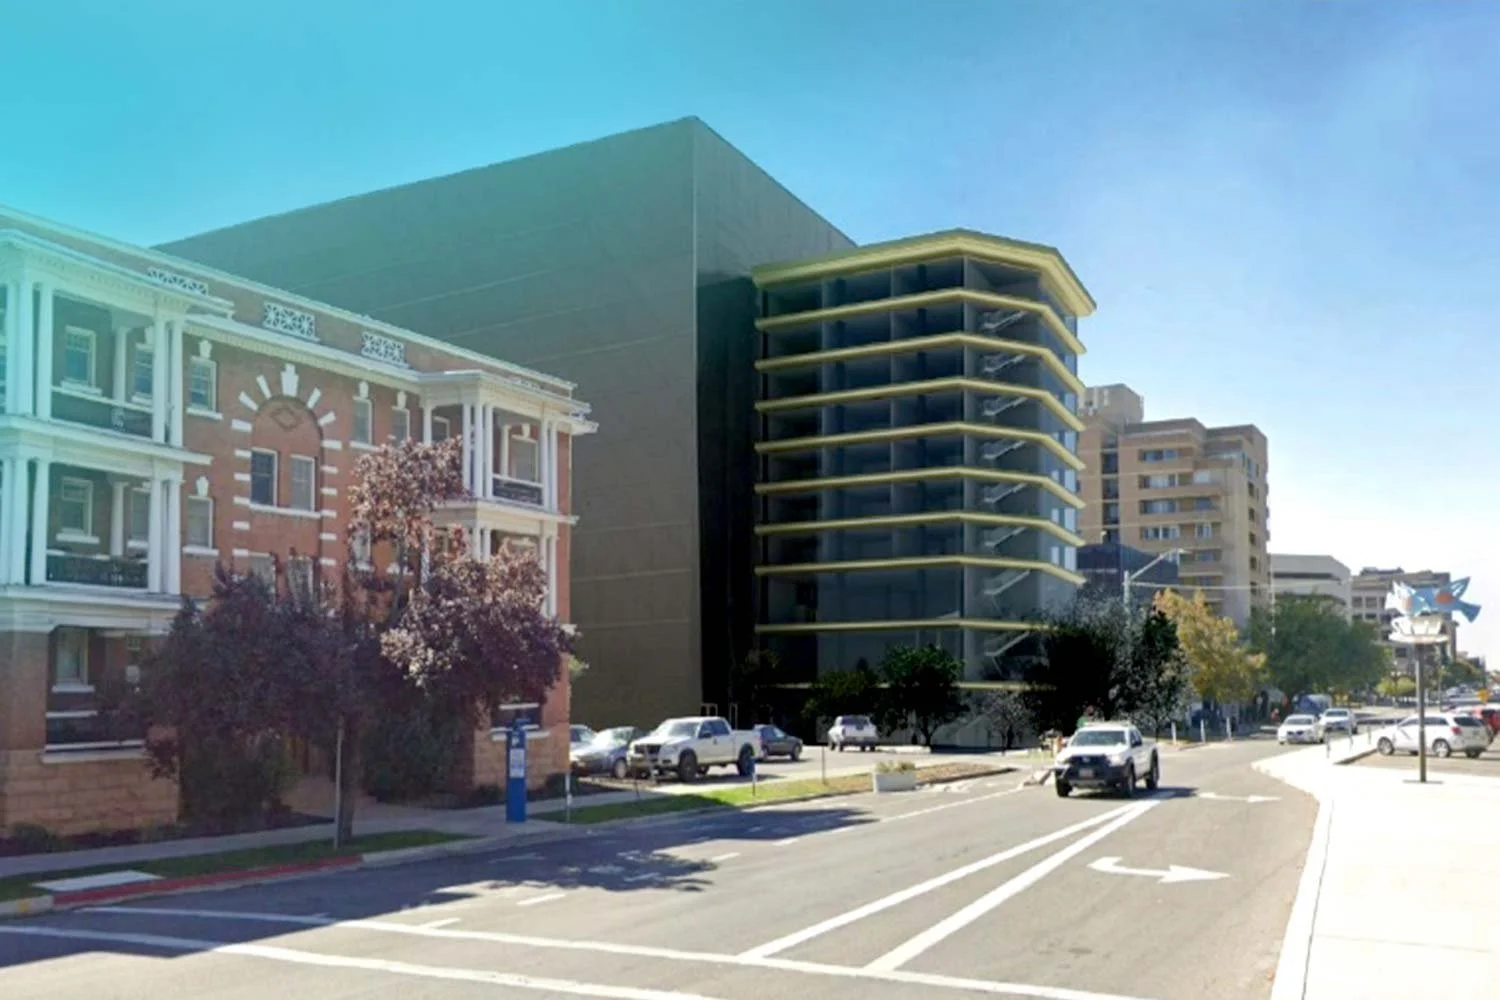
Emerging Districts & Investments
-
![Sports, Entertainment, Culture & Convention District]()
Sports, arts, culture and convention district
The Utah Jazz and Utah Mammoth will anchor this $4 billion investment. It will include new hotels, convention facilities, and arts organizations.
-
![Rio Grande Neighborhood]()
Rio Grande Neighborhood
This SLC Community Reinvestment Agency’s project proposes a new Downtown neighborhood on 11 acres between the landmark Rio Grande Depot and Intermodal Transit Hub.
-
![A Public Private Partnership & Public Building in Pioneer Park]()
A Public Private Partnership & Public Building
Downtown Alliance and Salt Lake City are actively pursuing initiatives in Pioneer Park. Daily activations managed by on-site Ambassadors are planned as is a public building to house the Downtown Farmers Market and other programming. SLC Public Lands is adding pickleball courts, water features, gardens, and upgrading the basketball courts, play areas, and the dog run. This is a bold investment to activate the park and make it safe for all.
-
![A Modernized Convention Center]()
A Modernized Convention Center
The Salt Palace Convention Centers will undergo a generational rebuilding to accomodate more high-spend visitors. The new center will have more versatile space and a second ballroom, improved accessibility and amenities–positioning Salt Lake City for continued growth in conventions, room nights, visitor spending and economic development.
-
![A Six Month Open House at Historic Temple Square]()
A 6 Month Open House at Temple Square
The walls around historic Temple Square have come down and new visitor centers and gardens are taking shape. As renovation of the Temple are completed in 2027, The Church of Jesus Christ of Latter-day Saints will open the temple to the public during a 6 months open house. Church officials anticipate 3-5 million visitors will tour the temple 12 hours a day, 7 days a week from April to September. With an estimated 22,000 daily visitors, the Alliance estimates $320 million in additional spending at downtown merchants, restaurants and venues.
-
![2034 Olympic Winter Games]()
2034 Olympic Winter Games
The Winter Olympics are nine years away. In addition to the entertainment district investments and other new hospitality amenities, Salt Lake City is exploring infrastructure improvements to welcome the world back downtown and support longterm visitation and economic development. These include a Green Loop around downtown, Main Street beautification, enhancing the “grand boulevards” 500 South and 600 South connections to Interstate 15 and developing the Rio Grande neighborhood.


Development Pipeline
-
![Raven One]()
Raven One
Residential | Mixed Use | Cumming Capital Management | Preconstruction
-
![The Wade Building]()
The Wade Building
Hotel | Mixed Use | The Wade Family | Preconstruction
-
![Seraph]()
Seraph
Office-to-residential conversion | 2025
-
![The Edison]()
The Edison
Residential/Mixed Use | J. Fisher Cos. | July 2027


Praise for Downtown SLC
-

#3 Best Performing City
-

#1 Best Airport in North America
-
#1 Best Places for a Fresh Start
-

#1 Most Fiscally Fit City
-

#2 Friendliest City
-

#24 America’s Best City
-

#1, Best State in the Country
#33, Best Place to Live -

#3 Best Places for Thanksgiving
-

#6 Most Kid Friendly
-

#11 Best State Capitols
#3 Best Place to Find a New Job
#1 Coffee Shops per Capita
#3 Best City for Young Professionals

Thank You to Our Economic Benchmark Report Sponsors

Report Acknowledgements
Data sources: CBRE Research, Kem C. Gardner Policy Institute, Mountain West Commercial Real Estate, Salt Lake City Airport, Utah Transit Authority, Visit Salt Lake, Placer.ai
Compiled and Written: Downtown Alliance staff
Graphic Design: 8TH Grade English
Special Thanks: CBRE and Sierra Hoffer, Field Research Manager and Erin Laney-Barr, Managing Director
Thank you to the Downtown Alliance Advisory Board: Chloe Gehrke (Chair), Lyonis Management; Benjamin Brown (Vice Chair), Fidelity Investments; Allison Behjani (Immediate Past Chair), Ray Quinney & Nebeker, Kim Abrams,Goldman Sachs; George Arnold, Hamilton Partners; Tracy James, Boyer Company; John Dahlstrom, Wasatch Commercial Management; Michael Dehner, PRI; Mark Powell, Delta Center; Nico Bamberger Priskos, Internet Properties; David Harris, City Creek Center/Taubman; Amy Leininger, RUIN; Chris Kirk, Colliers; Nadia Letey -CBRE, Garrett Parker -Hilton, Ana Valdemoros, Argentina’s Best Empanadas; Wendy Leonelli, JFisher Co.; Kelsey Berg, LHM Company; Addie McNamara, Smith Entertainment Group